My virtual notes
By Maria Paula Guillaumet
After accumulating notebooks with my notes for years, I decided to make a virtual repository with my topics of interest. Here you can find a little of this and that.
Después de acumular por años cuadernos con mis notas, decidí hacer un repositorio virtual con mis temas de interés. Aquí podrán encontrar un poco de esto y aquello.
View My LinkedIn Profile
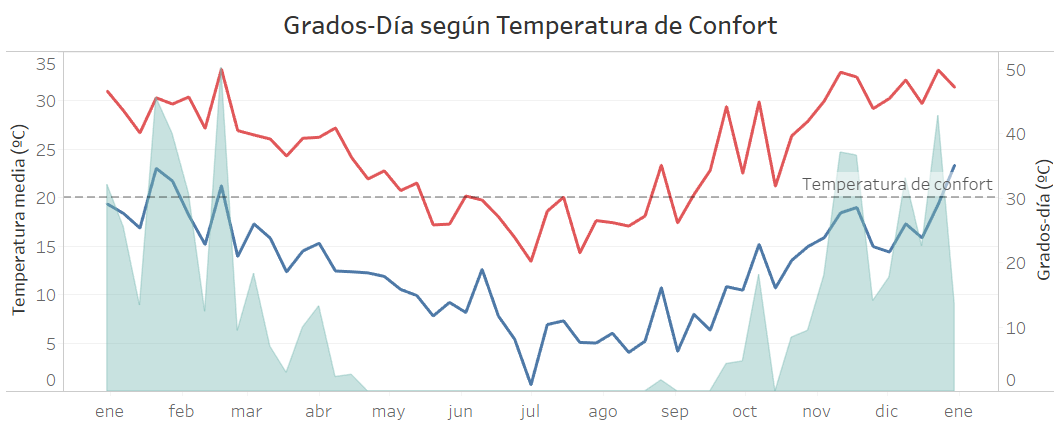
Data visualization
Data visualization is the graphical representation of information and data.
By using visual elements like charts, graphs, and maps, data visualization tools provide an accessible way to see and understand trends, outliers, and patterns in data.
In the world of Big Data, data visualization tools and technologies are essential to analyze massive amounts of information and make data-driven decisions.